
TYLER IS APPROXIMATELY
SQUARE MILES IN AREA
|
Tyler's Estimated Population
|
...BUT IT GROWS TO APPROXIMATELY
PEOPLE DURING THE DAY
|
|
|
DEMOGRAPHICS
AGE AND GENDER COMPOSITION (2010):
HOUSEHOLDS (2010):
RACIAL/ETHNIC COMPOSITION (2010):
LANGUAGE SPOKEN AT HOME (2010):
EDUCATIONAL ATTAINMENT (2010):
INCOME (2010):
- Median age: 33 years
- 24.3% under 18 years old
- 14.4% aged 65 or older
- 47.2% male
- 52.8% female
HOUSEHOLDS (2010):
- Total households: 37,896
- 16.5% increase since 2000
- 61.7% are family households (persons related by blood or marriage)
- 42.5% of all households are married-couple households
- 17.4% of all households are married couples with their own children under 18 years old
- 31.2% of all households are single-person households
- 2.4% are other non-family households (unrelated or single persons living together
- 15.2% of all households are headed by women
- 19.1% of all households are single-parent households
RACIAL/ETHNIC COMPOSITION (2010):
- 50.8% White, non-Hispanic
- 24.8% African-American, non-Hispanic
- 21.2% Hispanic/Latino, all races
- 2.4% Other, non-Hispanic
- Public school (Tyler I.S.D.) enrollment, 2010-2011:
- 39.4% Hispanic
- 31.4% African-American
- 27.5% White
LANGUAGE SPOKEN AT HOME (2010):
- 17% of the population 5 years or older and speaks Spanish at home
- 1.6% speaks a language other than English or Spanish at home
- 9.4% of the population 5 years and older speaks English less than “very well”
EDUCATIONAL ATTAINMENT (2010):
- 29% of the population has a bachelor’s degree or higher
- 16.3% does not have a high-school diploma
INCOME (2010):
- Median household income- $41,607 median family income- $54,547
- 32.3% of households have incomes of less than $35,000
- 17% of households have incomes of $100,000 or more
- 15.2% of families have incomes below the poverty level
- 17% of individuals have incomes below the poverty level
- 30% of children under 18 live below the poverty level
- 8.8% of elderly households live in poverty
SINCE THE ADOPTION OF TYLER 21 IN 2007, THE CITY HAS ADDED
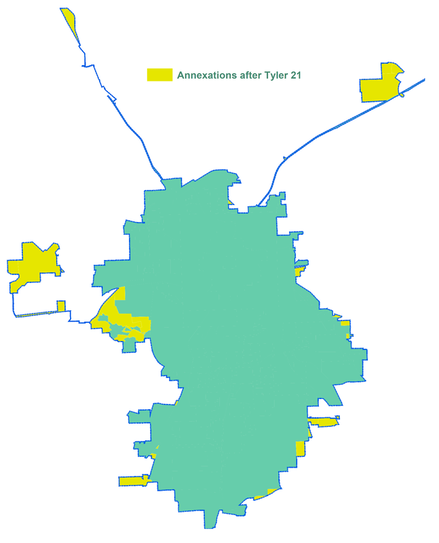
ACRES (OR 5 SQUARE MILES) OF LAND THROUGH ANNEXATIONS
WHAT DOES IT MEAN?
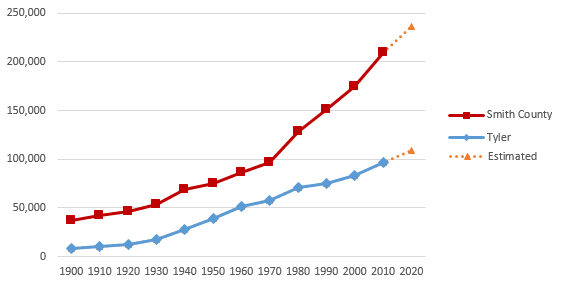
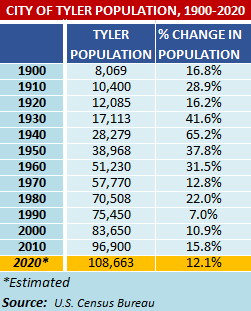
- Tyler’s population grew at an average annual rate of 1.86% between 1980 and 2010.
- 2020 population estimates show that Tyler grew by 1.15% per year between 2010 and 2020.
- Tyler’s percentage of total county population has declined since 1980 due to new subdivisions being built outside the city.
- Tyler’s millennial population is higher than the state average.
- Most Tyler households are family households.
- Almost a third of all households are single person households.
- Tyler’s Hispanic population grew by about 55% between 2000 and 2010, but the city still has a lower percentage of Hispanics than the state as a whole.
- Tyler proportionately has more African-Americans in its population than the state as a whole.
- Almost a third of Tyler children lived in poverty at the time of the 2010 census.
