HOUSING AND NORTH END REVITALIZATION |
|

TOTAL AND TYPE OF HOUSING UNITS (2019)
HOUSING UNITS IN THE CITY OF TYLER
|
PERCENT ARE SINGLE-FAMILY HOUSES
|
PERCENT ARE IN 2-9 UNIT BUILDINGS
|
PERCENT ARE IN 10+ UNIT BUILDINGS
|
AGE OF HOUSING STOCK (2011)
14% BUILT BEFORE 1950
|
49% BUILT BEFORE 1990
|
10% BUILT SINCE 2000
|
OWNERSHIP AND RENTING (2011):
PERCENT OWNER-OCCUPIED
LENGTH OF TIME IN CURRENT RESIDENCE (2011):
75% OF RESIDENTS LIVED IN THE SAME HOUSE IN 2000
14% OF RESIDENTS HAVE LIVED IN THE SAME HOUSE SINCE 1989
3% OF RESIDENTS HAVE LIVED IN THE SAME HOUSE SINCE 1969
14% OF RESIDENTS HAVE LIVED IN THE SAME HOUSE SINCE 1989
3% OF RESIDENTS HAVE LIVED IN THE SAME HOUSE SINCE 1969
|
MEDIAN HOUSING VALUE (2018):
|
DOLLARS
|
HOME SALES AND AVERAGE PRICE:
- 1,199 TOTAL SALES IN 2018 (2% DECREASE FROM 2017)
- AVERAGE PRICE: $231,734 (4% INCREASE FROM 2017)
NORTH END REVITALIZATION EFFORTS
- Continued partnering with several financial institutions and non-profits to assist clients with lower than average credit scores to buy a home.
- Launched a pilot Neighborhood Empowerment Zone (NEZ) to incentivize new condo/townhome development in Northchase via waiving of development related fees.
- Tax Increment Reinvestment Zone #3 (North End TIRZ) created in 2008 with participation from Smith County and Tyler Junior College.
- Completed Texas College Area Development Plan.
SECTION 8 TO HOMEOWNERSHIP (2014-2019):
- Total of 4 Section 8 families assisted with homeownership.
- 4 families currently assisted with mortgage payments
- 4 families assisted with buying home without Section 8 assistance with City’s First-Time Homebuyers Program.
- 4 families currently assisted with mortgage payments
NEIGHBORHOOD SERVICES (2014-2019)
- New Neighborhood Services building on W. Gentry purchased to establish a central information center on the affordable housing programs.
- Assisted with the rehabilitation of 89 52 homes in the North End.
- Improvements made to City Park including:
- Purchase of new playground equipment
- Installation of lighting
- Landscaping enhancements
- 7 3 street improvement projects including:
- Curb and gutter
- Drainage improvements
- Street overlays
- Coordinated construction of 15 3 new single-family homes in the North End.
- $257,610264,082 provided to North End homebuyers for down payment assistance.
wHAT DOES IT MEAN?
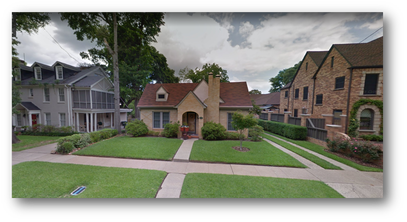
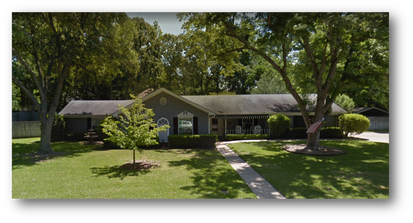
- Most of Tyler’s housing is composed of single-family houses.
- The homeownership rate for Tyler is lower than the statewide rate of 63%.
- The downward trend in the average price for an existing single-family home has ended, and prices are beginning to trend higher than pre-recession levels.
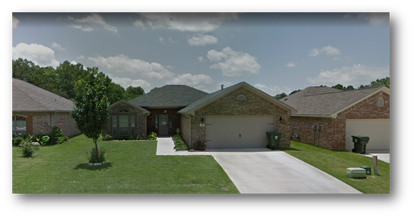
- New houses are, on average, much larger and more expensive than existing homes.
- Nearly half of Tyler’s households do not receive enough income to afford the median-priced single-family home.
- The majority of new development in Tyler is taking place in the southern part of the city.
